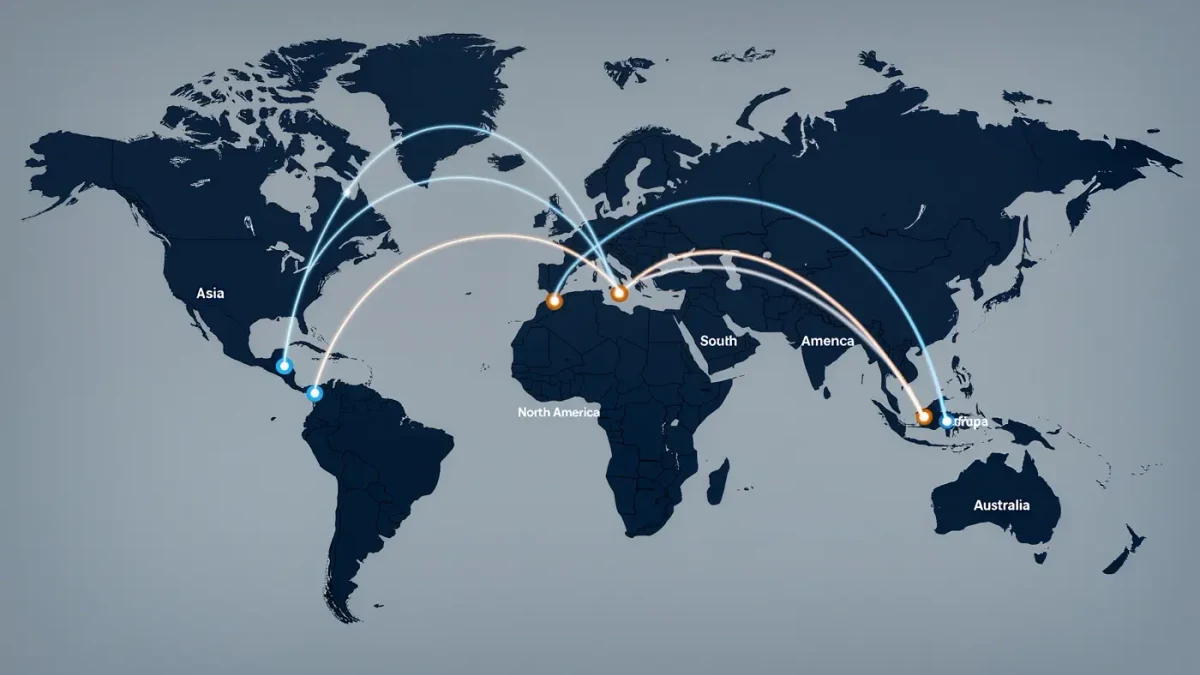
Asian countries supplied 70.2 percent of United States apparel imports by value in April 2026, down from 72.0 percent a year earlier, per University of Delaware trade researcher Sheng Lu's analysis of official data, updated on June 10. The two-point shift sounds incremental; in a market of roughly $80 billion a year it is billions of dollars of sourcing migrating, and per the same analysis, imports from countries outside Asia and the Western Hemisphere hit a record 14.1 percent share in April, up from 12.3 percent in April 2025. The tariff regime is redrawing the sourcing map in real time, and the monthly customs data is where the redraw shows first.
Where is the share going?
To many places at once, which is the point. Per Lu's published breakdowns, the gains concentrate in Central America, the Caribbean basin and select South Asian suppliers — the Western Hemisphere and near-Asia countries whose tariff treatment now beats the rates stacked on the traditional hubs. Per the negotiating record through the first half of 2026, rates settled bilaterally created winners and losers where none existed in the previous cost structure: a country's new advantage is its trade deal, not its wage level. The data shows the consequence directly — no single successor to China's share, but a broad diffusion as brands split orders to hedge the next rate change.
What does the migration cost?
Efficiency, paid in margin and lead time. The Asian hub system spent thirty years optimizing specialized ecosystems — one region for knitwear, another for denim, a third for outerwear — with consolidated freight and deep vendor financing. Per the cost breakdowns sourcing analysts publish, nearshore alternatives carry higher unit costs but shorter lead times, which matters most for replenishment. The April data's diffusion pattern is therefore not just geography but a trade: brands are paying more per garment for the ability to react faster and to diversify tariff risk. Per the import values in the same dataset, total spending on clothing imports fell even as diversification rose — the market is shrinking and scattering simultaneously.
How reliable is the monthly data?
More than any corporate disclosure. Customs entries are recorded for revenue purposes, so the figures are auditable by construction, and per the publication schedule of the official portal, monthly data lands with a lag that the university analyses compress into readable form. The April figures carry two caveats: single months can reflect shipping-front-loading around tariff deadlines rather than trend, and value shares shift with cotton and freight prices independent of volume. Per the year-over-year comparison Lu maintains, the 2026 diversification held across multiple months, which is what distinguishes a trend from a deadline effect.
What does a changing sourcing map mean for the rack?
Quality variance, before anything else. A garment program moving from a specialized hub to a newer production country rebuilds its operator base and quality curve, per the construction dynamics that follow every sourcing shift — and the diffusion pattern in the April data multiplies how many programs are in transition at once. Per the concentration record of the past decades, buyers learned a hub's consistency without knowing they were learning it. The record share of imports from outside the traditional map means that, through late 2026, more garments than at any point in a generation come from factories their brands are still learning to audit.
For more context, read The 35.1% Tariff on American Clothing Imports, Read Line by Line.
For more context, read garment worker wages 2026.
For more context, read retail bankruptcy 2026.